Fresh from Shipaton

Pollenwarte
Pollenwarte shows what is in the air today — the way pollen looks under a microscope:…
Loading activity…
2026Shipaton
CategoryHealth & Fitness
DeveloperAnton Romanyuk
iPhone · iPad




About this app
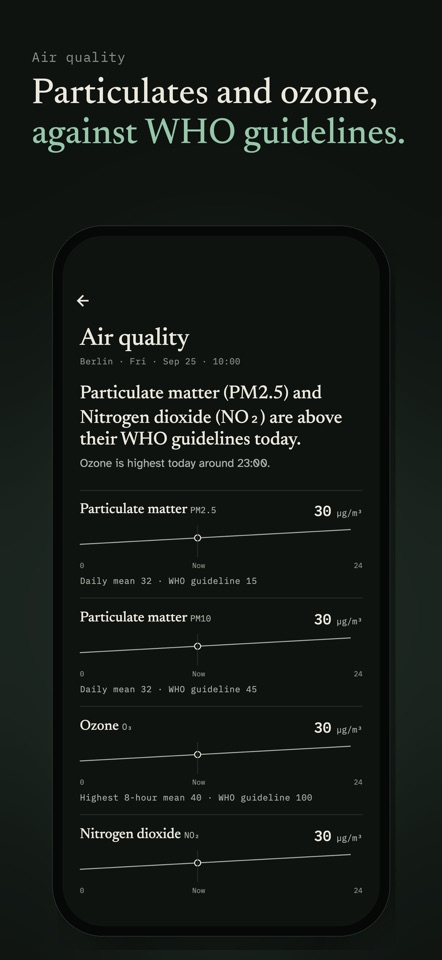
Pollenwarte shows what is in the air today — the way pollen looks under a microscope: grain by grain, each species in its own shape. THE FIELD OF VIEW The home screen is a field of view, like a microscope slide. The grains of your selection drift in it, each species drawn as its real grain at its real relative size, as many as the value earns. Below it: the strongest species with its value and level, its day with the quietest window, and all your species with the next four days. HOURLY FORECAST Values come from the European CAMS model in pollen per cubic metre of air, served through Open-Meteo, for alder, birch, grass, mugwort, olive and ragweed. In Germany the Deutscher Wetterdienst pollen hazard index is shown alongside, adding hazel, ash and rye. EVERY SPECIES AT A GLANCE Each species has its own sheet: the grain magnified, its size and structure, the current value on its threshold ladder, four days hour by hour, the DWD values and the flowering season. DIARY AND ANALYSIS Log the day with one tap on “Log today”, with an optional 8 pm reminder; the diary keeps symptoms, severity and notes, and the month shows them as dots whose size carries the severity. The analysis says in one sentence which species was in the air more on your worse days — and that this is a pattern in your entries, not a diagnosis. How it is calculated is one tap away. HONEST STATES When a value is missing it says "no data", never zero. Cached forecasts always show their age. All times follow the timezone of the selected place. MORE • Dark by default, paper as the light option, or automatic to follow the device • Save and switch between several places • Home Screen widget with the field of view, the strongest species and the quiet window • Local notifications when values spike • Air quality: particulate matter, ozone and nitrogen dioxide against the WHO guideline levels • Pollen lexicon with a named source for every article • PDF report to take to a doctor's appointment • German, English, French, Italian • VoiceOver, Dynamic Type, Increase Contrast and Reduce Motion; hourly values and charts also open as a numeric table POLLENWARTE PLUS Plus shows the pollen map: heatmap layers for trees, grasses and weeds over any place you choose. Everything else stays free. Launch prices are introductory until 31 December 2026, monthly or yearly; the yearly plan starts with 7 days free. After that, Plus costs €2.99 a month or €14.99 a year in euro countries. The app shows the price in your currency before you buy. Payment is charged to your Apple Account. The subscription renews automatically unless cancelled in your Apple Account settings at least 24 hours before the end of the current period. Terms of Use: https://www.apple.com/legal/internet-services/itunes/dev/stdeula/ Privacy: https://pollenwarte-app.web.app/privacy-en PRIVACY No account, no sign-up, no advertising, no tracking, no analytics SDKs. Diary, settings and places stay on the device. Only coordinates are sent to the forecast services. Purchases go through Apple and are checked with an anonymous ID at RevenueCat. NOTE Pollenwarte shows modelled forecast values and notes you record yourself. It is not a medical device and does not replace professional medical advice, diagnosis or treatment. The level bands are presentation conventions of this app, not medically validated thresholds. Data sources: Open-Meteo (CAMS), Deutscher Wetterdienst, Google Pollen API, OpenStreetMap and CARTO.


